
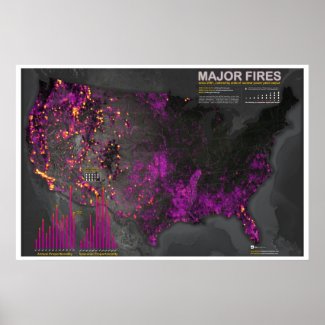
As it happens, the same satellite that scans for fires also provided the basemap image. I heart NASA.

Anyways, each dot represents a moment of pretty extreme heat, down to the one square kilometer level (I only retained fires greater than 100
There are a couple temporal charts in there, too. The seasonal curve I would expect, but the overall upwards trend was interesting (and 2012 is only half through). Is it related to a lag-offset El Niño or La Niña effect?
It's almost like the universe balancing itself out, considering the general density of historical tornadoes. Except poor Florida gets a heaping pile of both. Can there be a fire tornado? If so, look out, Tampa. Also, what's cooking in the south Mississippi basin? And check out the firewall of the Cascades -You shall not pass!
Here's an animated version of this map, isolating each year's fires and highlighting their aggregated intensities on the chart.
Other Sort-Of Related Maps
If this map is interesting to you, you might be amenable to plunging down the rabbit hole of related visualizations...


I would say that a good number of the fires you see in the southeast are prescribed fires, although those showing a higher energy content are most likely from wildfires (an easy example is the long burning wildfire evident in the Okefenokee Swamp area). The fires seen in the Mississippi basin and extreme south Florida below Lake Okeechobee are most likely agricultural burns. Great map though - it provides a nice opportunity to interpret burning patterns.
ReplyDeleteThanks, David for the insight! I was really wondering about the persistent coverage in the agricultural areas and prescribed burns make a lot of sense. Really interesting. I'm relieved now I didn't call it "Wildfires"!
DeleteOverall, the map makes me wonder about land management in southwest California. Are we seeing the penalty of over protection of a landscape that would historically depend on natural semi-regular fires to manage tinder buildup which, when prevented, accumulates loads of fuel that rage in an inevitable fire?
John you nailed it for much of the United States, not just SOCAL. Without regular fire on the landscape we've seen significant fuel accumulations across the country from CA to CO and from MO to FL. As a result of those accumulations interacting with droughts and seasonal variations, we're experiencing changes in fire frequency / behavior / severity and even season. I would be interested to see your map animated over time. I think with a temporal component you might be able to get a better idea of what -kinds- of fires you're looking at on the landscape.
DeleteTaking the "Earthquate" map, this map, and after you do the "Violent Crime", "Air and Water Pollution", and the "Attorney Density" maps, please overlay them into one composite and let's see if I can find an acre or two I can safely purchase.
ReplyDeleteYour parameters optimize towards Winnipeg, as you forgot to include snowfall/blizzard and flooding data. Otherwise, look at this: http://www.hazardscaucus.org/USHazPoster.pdf Possibly also http://www.wired.com/culture/education/magazine/17-09/st_sinmaps and http://www.pophealthmetrics.com/content/9/1/16
DeleteThere certainly can be a "fire tornado". They're called "firestorms" (Wikipedia) and the US Air Force made quite a few of them during WWII. Check particularly Dresden and Tokyo.
ReplyDeleteI find myself wondering where 2001-2011 were on their annual proportionality bars on July 9th. 2012 has already reached third place with most of this year's fire season still to be tallied.
ReplyDeleteVery nice graphic.
I am not sure exactly how to interpret the "annual proportionality". It appears that it's a histogram of pixel-day counts for the different intensities. If so, it may be more useful to look separately at just the more intense fires. While 100 MW may sound impressive (I am not familiar with measuring fires in MW), I suspect it is not really much by fire standards. Much of the annual variation seems to be from these less energetic fires, which in many cases are probably prescribed/controlled. Also for some historical context, there probably would have been much much more fire across the prairies if we could look at 500 years ago, before agriculture, European settlement, and active fire suppression.
ReplyDeleteLoren, I share your hunch. I'll take a look and make a version of the frequency chart for only the larger magnitude fires to see how that shows. Thanks!
DeleteI am surprised to see in the bargraph from 1991 to present that 2011 looks like a big year for fires. The hydrology was so wet from the snowpack. What am I really seeing/
ReplyDeleteLove your work John!
ReplyDeleteWould you be able to do another one showing fireballs/meteor/overhead cometary explosions? There's some debate going on out there as to whether or not their numbers have increased in the past decade. If you go here, someone has analysed American Meteorological Society data to show a startling rate of increase. You might wanna check the data for yourself, or even find supporting sources? That won't be easy though cause the Pentagon restricted access to its satellites' data in 2009.
http://www.sott.net/articles/show/247582-Reign-of-Fire-Meteorites-Wildfires-Planetary-Chaos-and-the-Sixth-Extinction#comment70927