
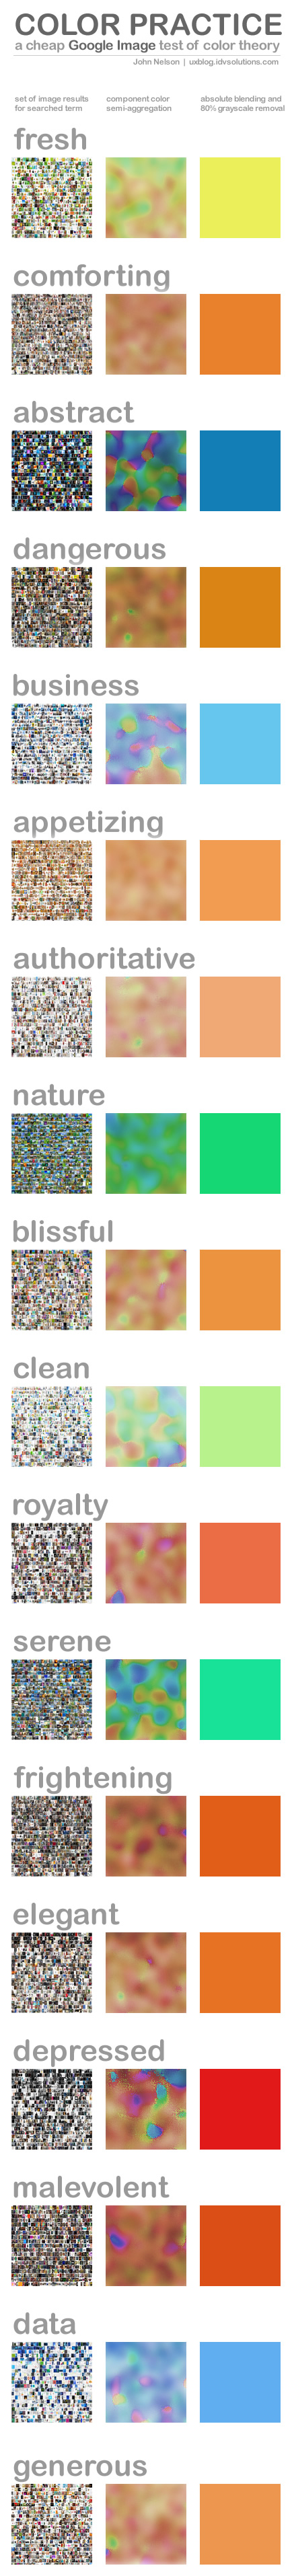
I figured that I could at least do a dry run of testing some of the associations I've heard before (orange is associated with appetite was something I heard years ago, and the more tenuous sounding association of purple with a sense of royalty -which just sounds like a regional cultural acquaintance).
So I fired up the Google and did an image search for lots of different terms to see how the interwebs have decided to associate images (which are just bunches of colored squares) with words. Here's what I got, which is more color practice than color theory, but an interesting tool nonetheless...
Scooped!
Then, as I was typing this VERY POST, Edward Tufte named the snapshot results of Google image searches "quilting," which is a pretty clever name. So you could say that these color tiles are a derivative of quilting.
1) Google image search a term, screenshot the results (now called "quilting"). Each term generates quilt of roughly 1,000 images. 2) Blur and saturate for basic mottling of colors and indication of contrast, 3) then a full averaging of all those Google image thumbnails (around 2 million pixels) into a single, average, color (you'll have to push the saturation to pull out all the gray and isolate only hue -I went 80%).
Not sure how to average all the colors? Neither was I, then I realized I could punt that to the image processor I was using (Fireworks) by scaling the quilt down to one pixel then scaling it back up. I suppose you could get very slightly different results depending on the program (and therefore re-sampling method used). Now you know all my secrets.
Pro Tip: if you are going to try this out, or even if you just want to do some Tufte quilting and stop there, your life will be so much easier if you change your browser's zoom to the smallest possible percentage so you can cram in more tiny images in one go rather than stitch together a bunch of larger screenshots.
More, Cooler Stuff
I've broken out some of these into individual term/color images which are over at our Flickr photostream. Also, because of the localization of Google search results, you can spoof other locations in the world to compare the cultural variability of color/term associations! The head spins.
Anyways, I have done enough painting in my life to know that the universe wants brown and the tendency of mixing a bunch of colors together will lead towards grayish brown. That's why I was surprised to see so many deviations from that neutral. An interesting follow up for someone with more chops than me would be to determine the extent and direction of each color tile's deviation from a web image "average" to score how how strongly the color/term association is -except when the association actually is brown.
Update
I did a comparison of terms across five languages with Google's localized search pages. Also, because of the vagueness of the mixed color result, I included histograms to provide more insight into how an average color ended up that way. You can find that new graphic here.
Hey there
ReplyDeleteCheck out "The Psychology of Color" by Carey Jolliffe. Great poster on the associations of color. http://careyjolliffe.files.wordpress.com/2013/02/cjga-color-theory-3.jpg
Gold (which connotes a positive sentiment)! Thanks for the link, Carlos. So many adjectives to test against now...
DeleteHave you tried out making your own tiles? It's pretty addicting.
You might also be interested in this chart depicting Colours in Cultures:
ReplyDeletehttp://www.informationisbeautiful.net/visualizations/colours-in-cultures/
Oh yes, I recall seeing this. Now I'll have some new eyes for it. Thanks Carl!
DeleteUnfortunately it's not an accurate method as the color it's related only to the atmosphere but not context and/or expressions.
ReplyDeleteExample: I can search for "fun" I will get pictures of parties or night clubs that are mainly dark but the expresion of people will be against the palette as dask colors that are not related to that concept.
An average is an average! It does average out to be just about exactly the color indicated in McCandless's culture color wheel.
DeleteFor what it's worth, when I do a search for Fun, I mostly get band pictures of FUN. But the mystery of the zeitgeist prevailed.
Cool Blog Posting. We've done this for years but using colored lights and alarm panel background colors in Command Centers. It is also interesting to note the different responses based on if the user is management or a field hand. Know your audience!
ReplyDeleteI'd love to see the quilting on the term 'quilting'.
ReplyDeleteHow recursive. And a great idea. Here's what that looks like:
Deletehttps://dl.dropboxusercontent.com/u/17180596/QuiltingQuilt.png
John, what is the land mass at the center of this fascinating map of storms? http://www.fastcodesign.com/1670605/infographic-160-years-of-hurricanes-form-one-giant-hurricane
ReplyDeleteIs it the south pole? Thanks so much
It is! I've re-run it with a brighter basemap and helpful coordinate grid overlay. Find the updated version here:
ReplyDeletehttp://uxblog.idvsolutions.com/2012/08/hurricanes-since-1851.html
Then click the map for a WAY bigger version.
Too cool! I've been playing with image processing lately & am going to take a crack at coding something that automates this. I'm not quite clear on what you suggested as a follow up. Can you expand on what you meant?
ReplyDeleteThat's great, I hope you keep me posted on what you come up with!
DeleteThere were two suggestions for follow-up. The first was to localize your google search (Google.de, Google.fr, etc.) to check on the cultural variability of the color average.
The second was a means of scoring a resulting color's distance from random (in my experience it looked like brown/orange was the color of not much strong color association). One could write a calculation that determines a color's "distance" from brown and therefore some sort of confidence value of the color association.
I would love to see your automated results!
who would have thought that dangerous and comforting would be so close in colour? Or elegant and frightening. lol.
ReplyDeleteWell, I've started to figure out that maybe taking an average is not a good method of finding the most accurate colour representations of meanings.
ReplyDeleteMaybe it can be taken out from the most dominating range of image's histogram. Especially when we talk about the chances that a particular colour will match common associations with given words or sentences.
Also I thought about the verification method in the form of a short survey consisting of a sentence and a number of random colour samples plus that evaluated one. If we get a clear distribution dominant pointing on a tested colour, we got it right.
I agree, Rafał. In a follow-up graphic, I show the resulting histograms to shed some light on multi-modal color uses. Here's teh link: http://uxblog.idvsolutions.com/2013/07/language-and-color.html
DeleteOh yes. I see. I humbly give myself repentance that I've just found Your works (five months after they got published) and did not read follow ups before I comment. :)
DeleteWhole subject is so exciting, interesting and the possibility to find better, clearer, more accurate and more universal forms of communication appears so tempting, especially when you realize that google (with all it's side effects) is just right at hand.
Respect, salutation.